Latest Projects
-
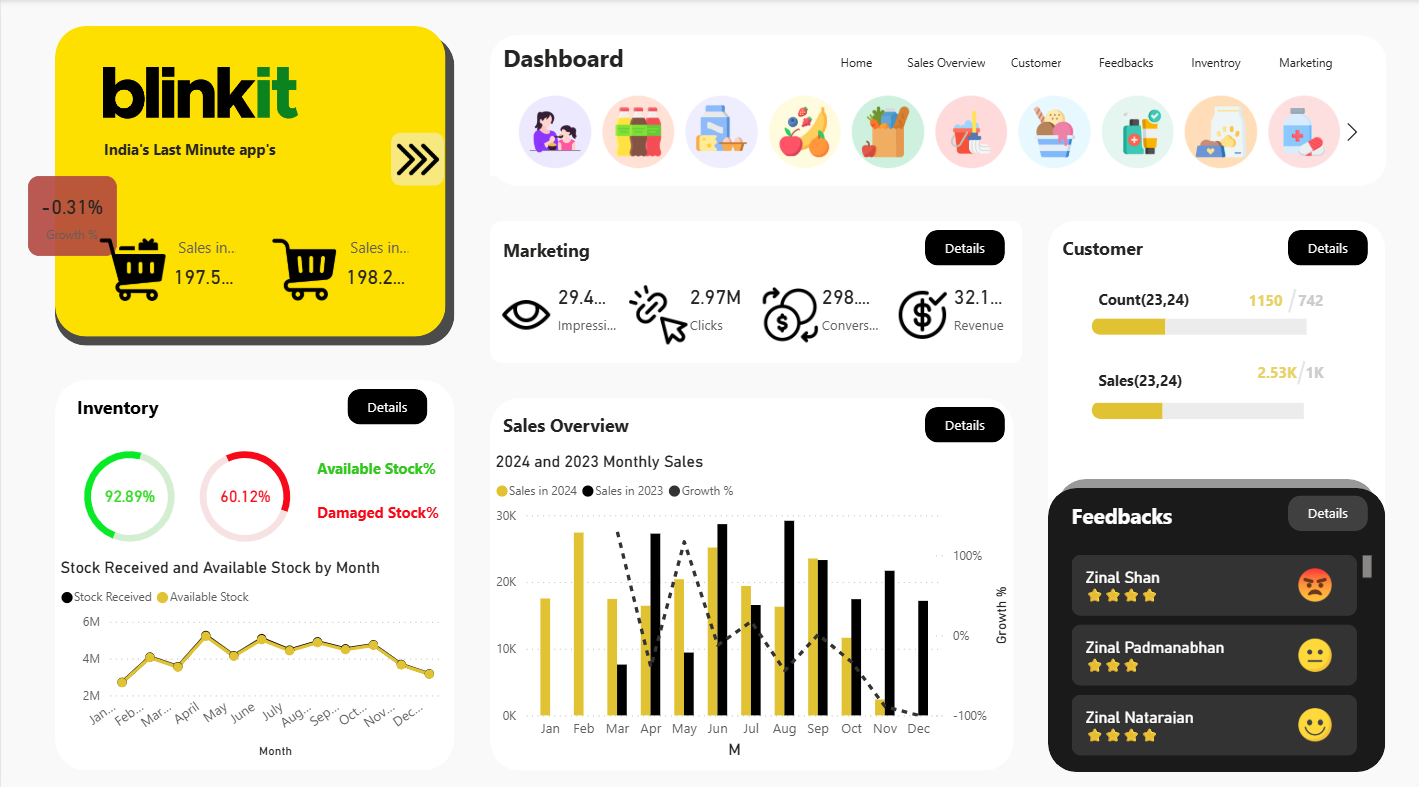
POWER-BI
Blinkit Dashboard With Power-BI
Developed a multi-page Blinkit Sales Intelligence Dashboard in Power BI, utilizing advanced DAX calculations to analyze year-over-year sales growth, customer segmentation, delivery performance, feedback sentiment, and campaign ROI — transforming raw data into clear visual insights for business stakeholders.
View Project -
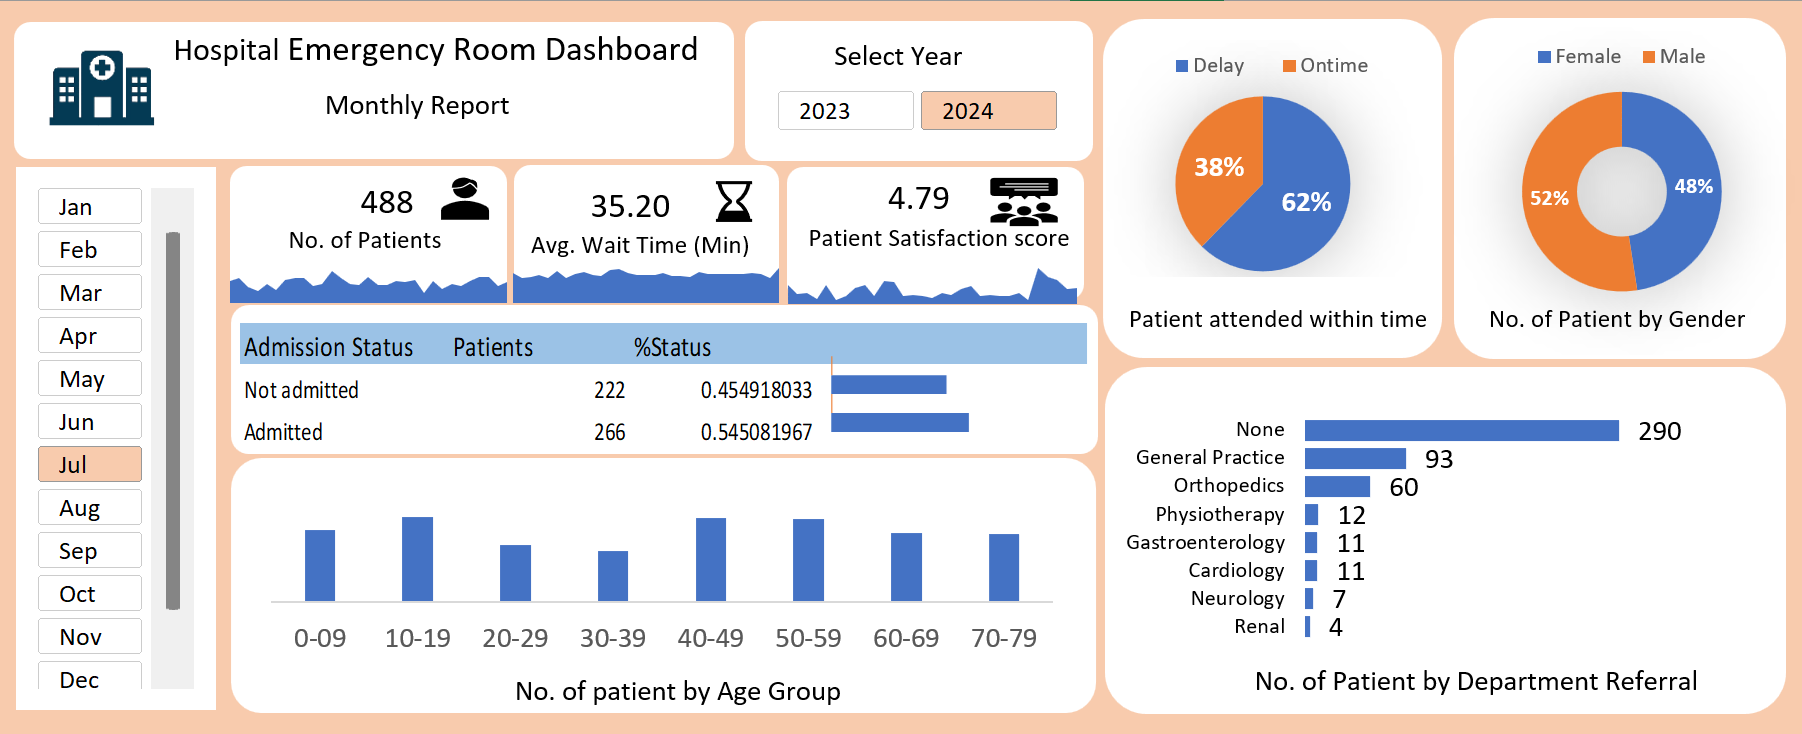
EXCEL
Hospital Emergency Room Dashboard Using Excel
Analyzed Hospital Emergency Room operations using Excel, building an interactive dashboard with slicers, charts, and formulas to track patient admissions, wait times, satisfaction, and referrals across 2023–2024.
View Project -
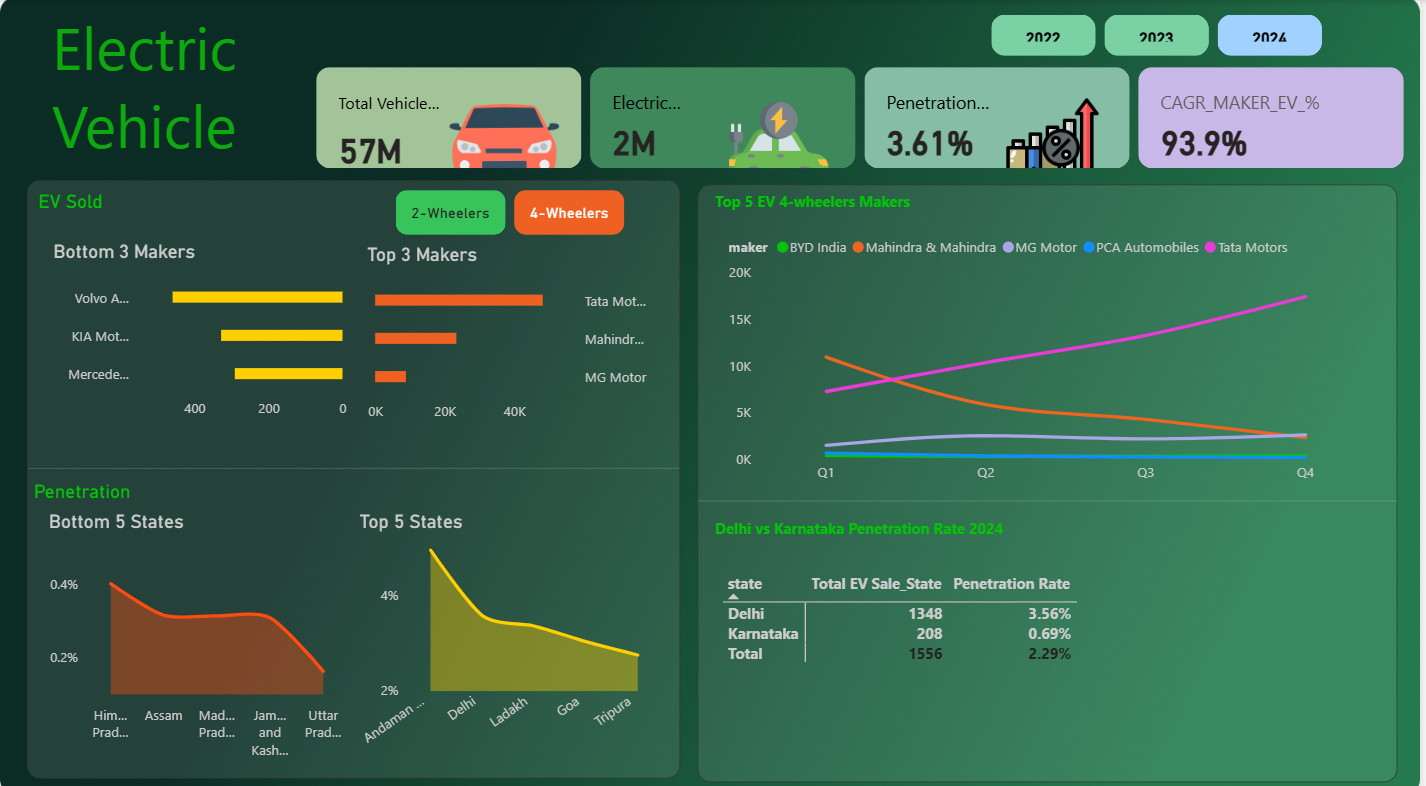
POWER-BI
Electric Vechile Dahboard Using Power-BI
Designed and developed an interactive Electric Vehicle Market Analytics Dashboard using Power BI, applying advanced DAX formulas to analyze 57M+ vehicles, 2M EV sales, market penetration rates, and 93.9% manufacturer CAGR — tracking top and bottom performing makers, 2-wheeler vs 4-wheeler segments, quarterly sales trends, and state-wise adoption rates across India for 2022–2024 — delivering actionable insights into the country's rapidly growing EV ecosystem.
View Project -
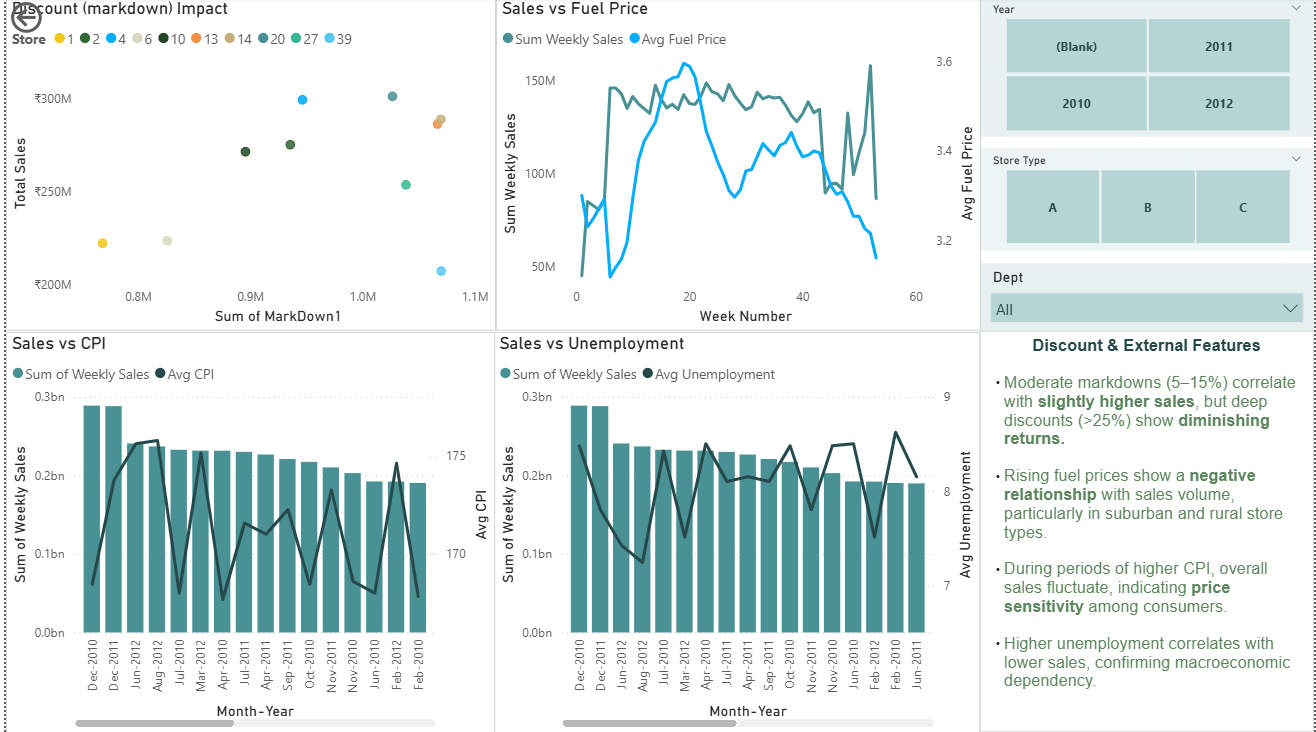
POWER-BI
Retail Sale Dashboard With Power-BI
Analyzed Retail Sales performance using Power BI, examining the correlation between weekly sales, markdowns, fuel prices, CPI, and unemployment across 39 stores and 3 store types — revealing critical insights into consumer price sensitivity and macroeconomic impact on revenue.
View Project